Seaborn: Visualize data beyond matplotlib

Let’s dive into “Seaborn vs Matplotlib”. Seaborn and Matplotlib are two popular Python libraries used for data visualization, each with its own strengths and weaknesses. Seaborn elevates data visualization beyond the capabilities of Matplotlib by offering a higher-level interface that simplifies the creation of complex statistical plots with stunning aesthetics. While Matplotlib provides a foundational framework for plotting, Seaborn builds upon it with intuitive functions tailored specifically for statistical analysis, enabling users to generate visually appealing plots with minimal code. With Seaborn’s built-in themes, color palettes, and streamlined syntax, exploring and presenting data becomes more accessible and efficient compared to the sometimes verbose and intricate processes required by Matplotlib.
1. Introduction to Seaborn:
Seaborn is a library based on matplotlib, for visualization of data. It gives a high-level interface for drawing attractive and statistical graphs which give more insights.
Seaborn has several built in themes and color palettes for users to create beautiful and pleasing visualizations. It lets us visualize categorical data through functions like Catplot.
To install seaborn
2. Seaborn vs Matplotlib
Matplotlib is a low-level plotting library that provides a high degree of control over individual elements. Even for basic functionalities, it requires more code.
Whereas seaborn is a high level library for visualization and requires less coding compared to matplotli.
Matplotlib lets users customize the appearances of plots, including color and styles.
Seaborn has in-built themes and color palettes making it easier for users to create visually appealing plots.
Matplotlib can work with pandas but users may need to manipulate data for certain type of plots.
Seaborn is very much flexible with pandas and it doesn’t require as much manipulation as matplotlib.
3. Why seaborn?
In order to get an idea of what it would be like when using seaborn and how it will benefit us over matplotlib.
Copy paste and run this code.
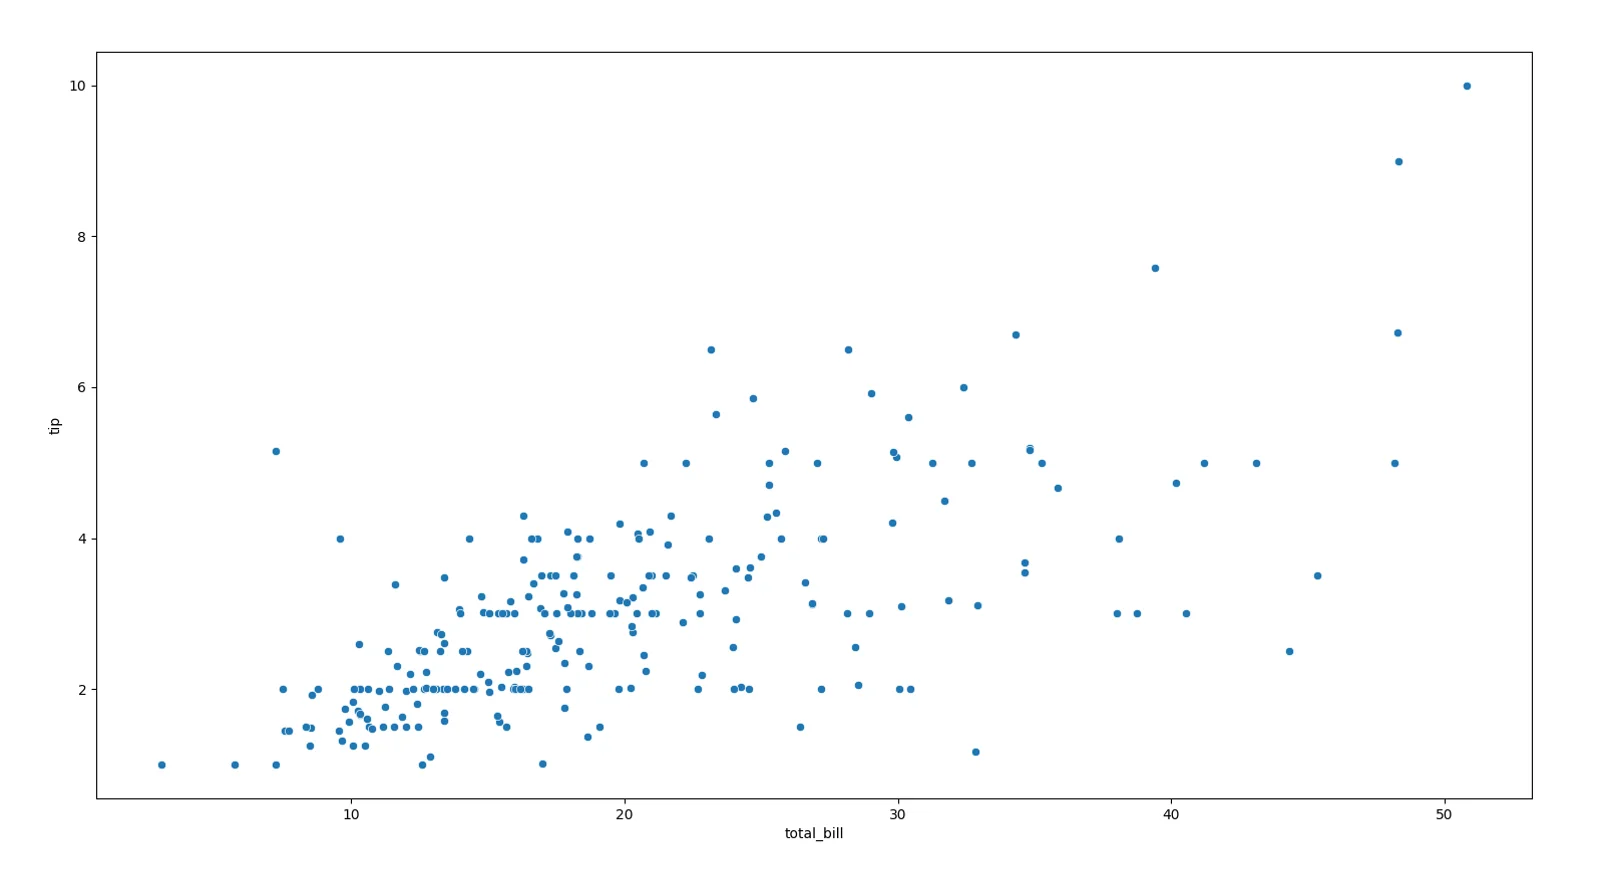
Output will look like the following

We have used seaborn library and this is what you should be seeing. Notice the regression line, we are able to add a regression line using a simple one liner.
In order to achieve the same thing in matplotlib, we shall be writing the following code
Output will look like the following
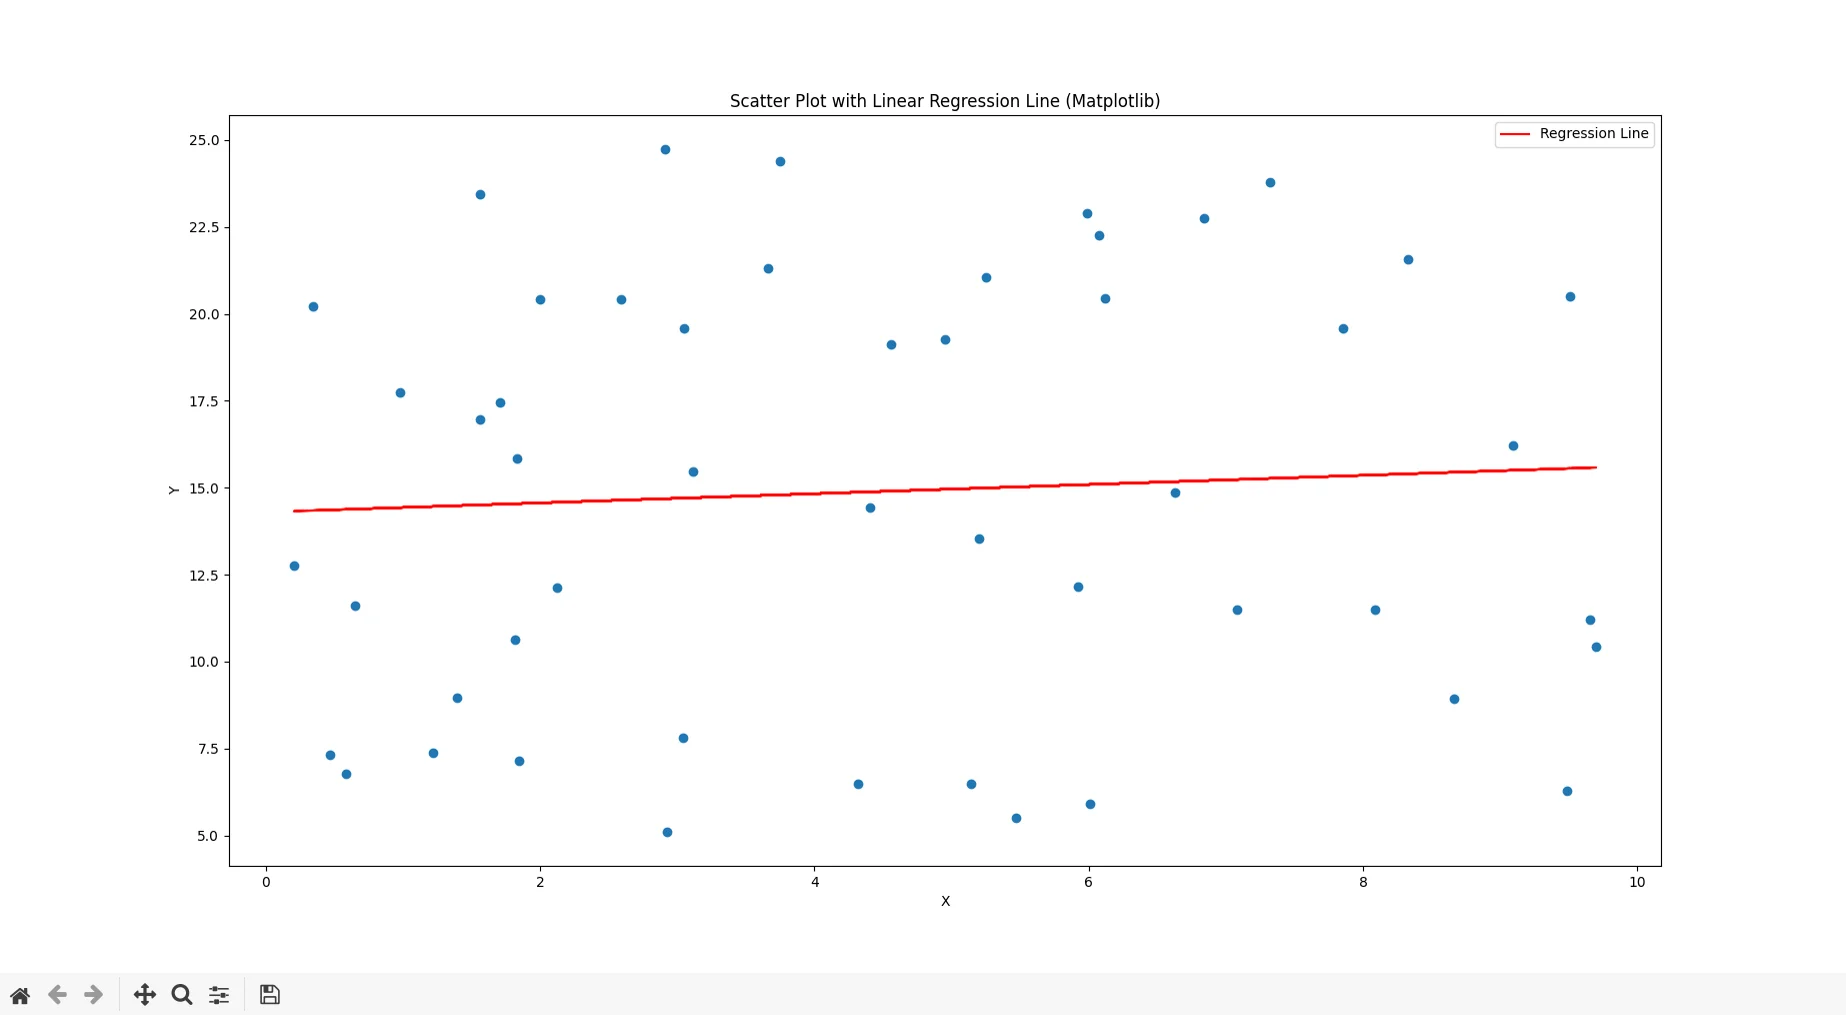
In order to achieve regression line using matplotlib, we are required to add
which is more when compared to code using seaborn.
4. Basic plotting in seaborn
Make necessary imports, and prepare your sample data
a. Scatter plot
We will be using scatterplot function
Now lets add two parameters, “hue” and “palette” to our scatterplot function
we should get something like this, it gives more insight than our previous scatter plot.

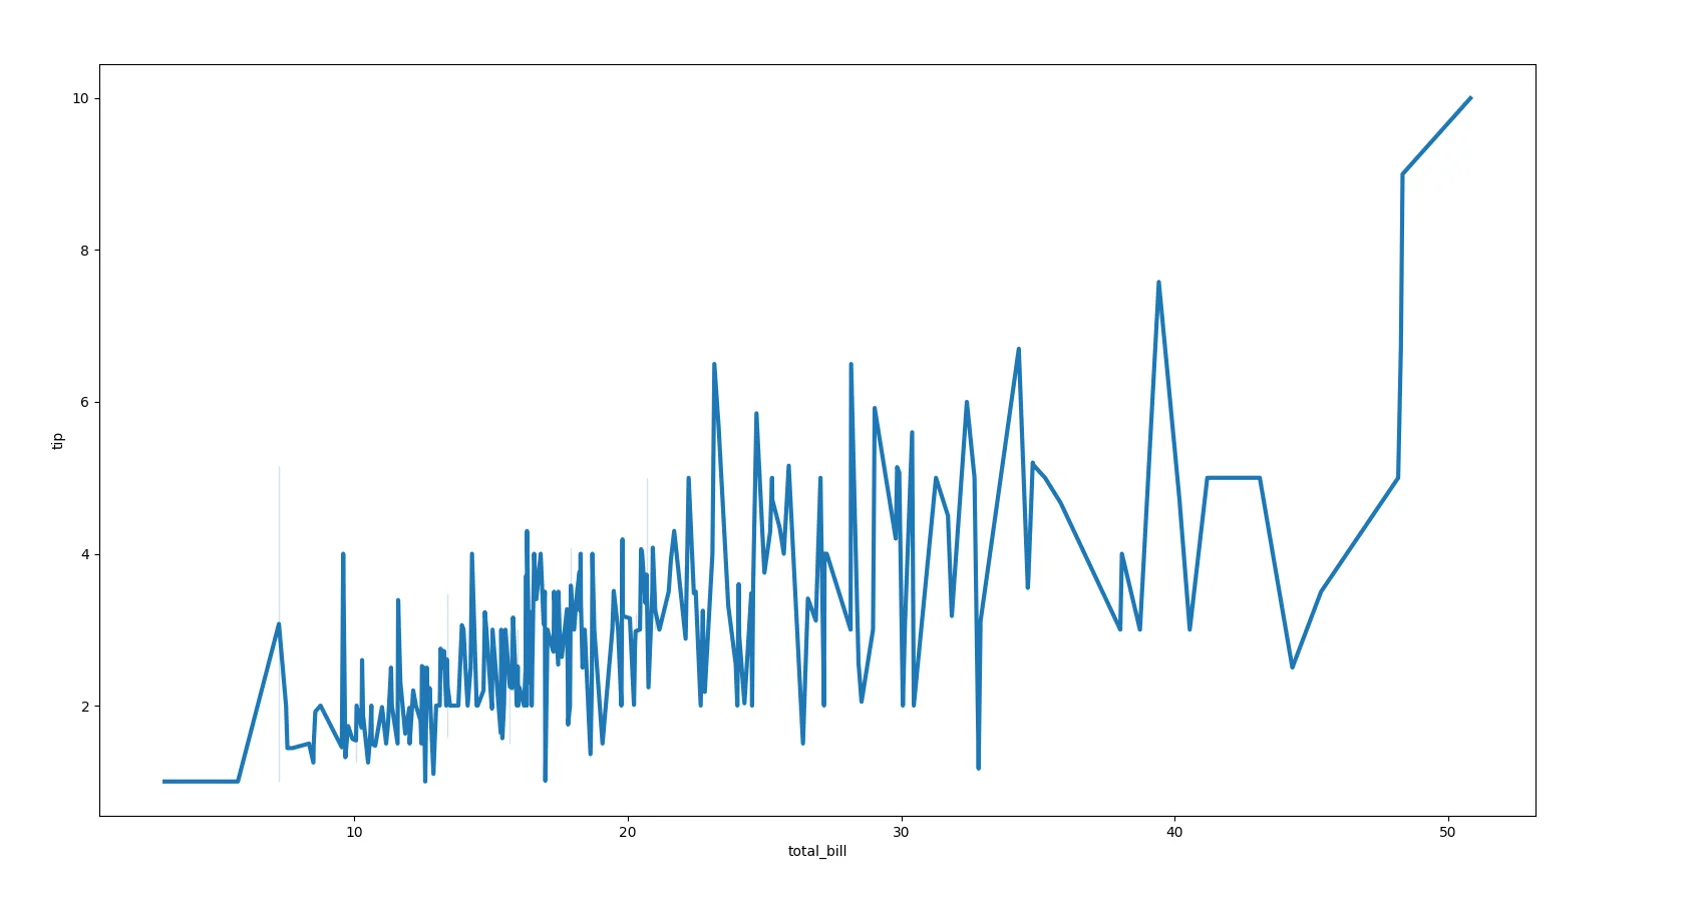
b. Line plot
We will be using lineplot function
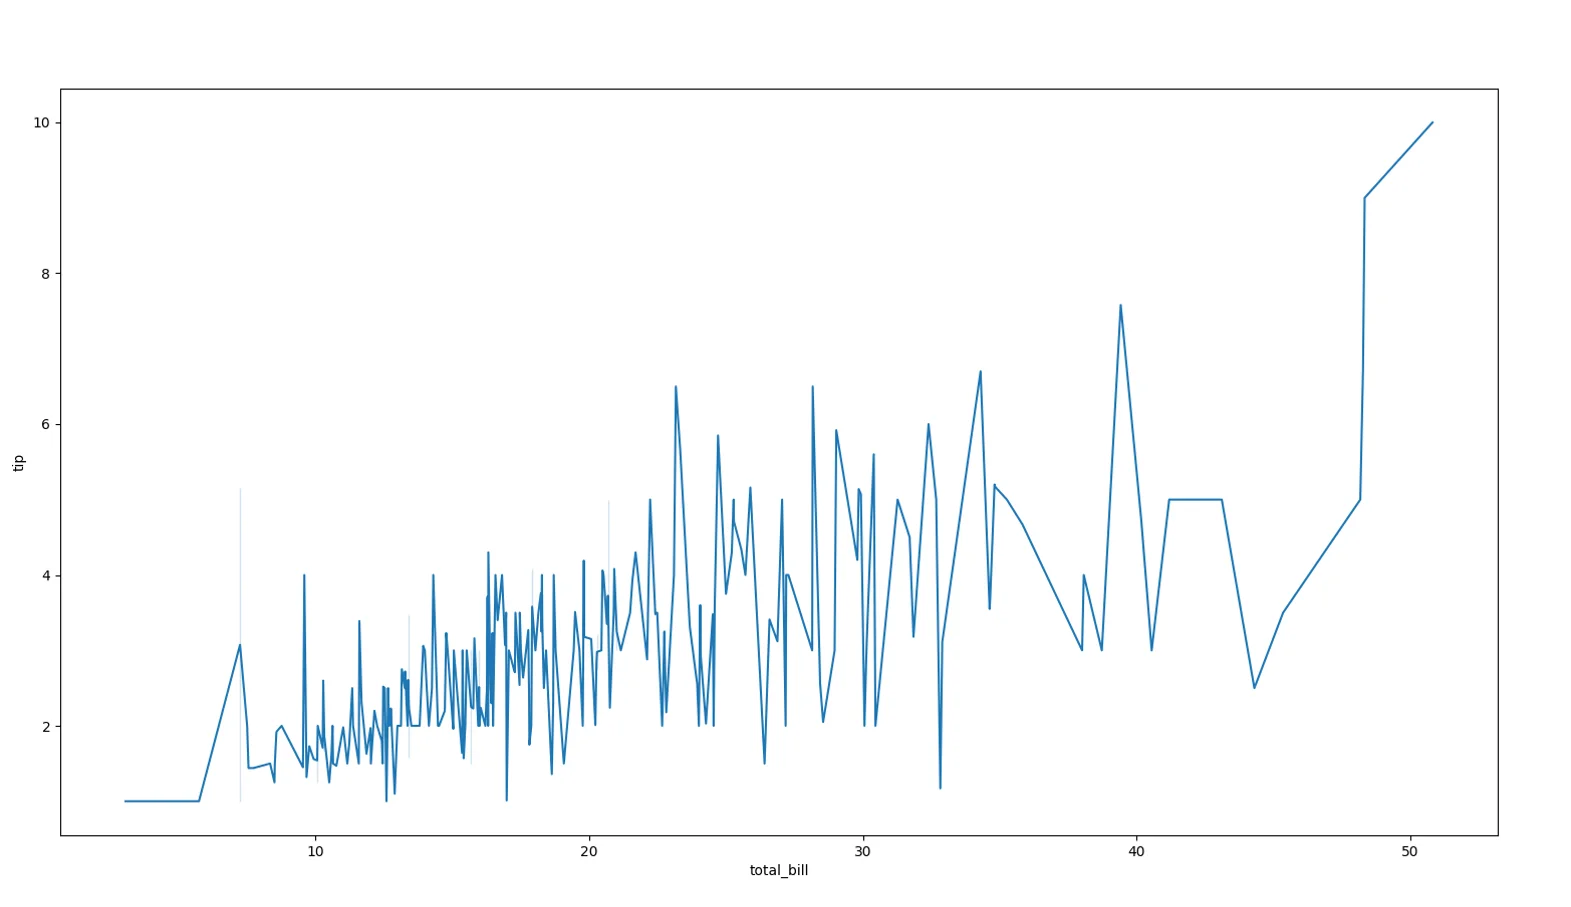
Using linewidth parameter, we can increase the width of lines. Pass the parameter to our line plot function and give it a value of 3
Output will be having thicker lines.
c. Bar plot
We will be using barplot function
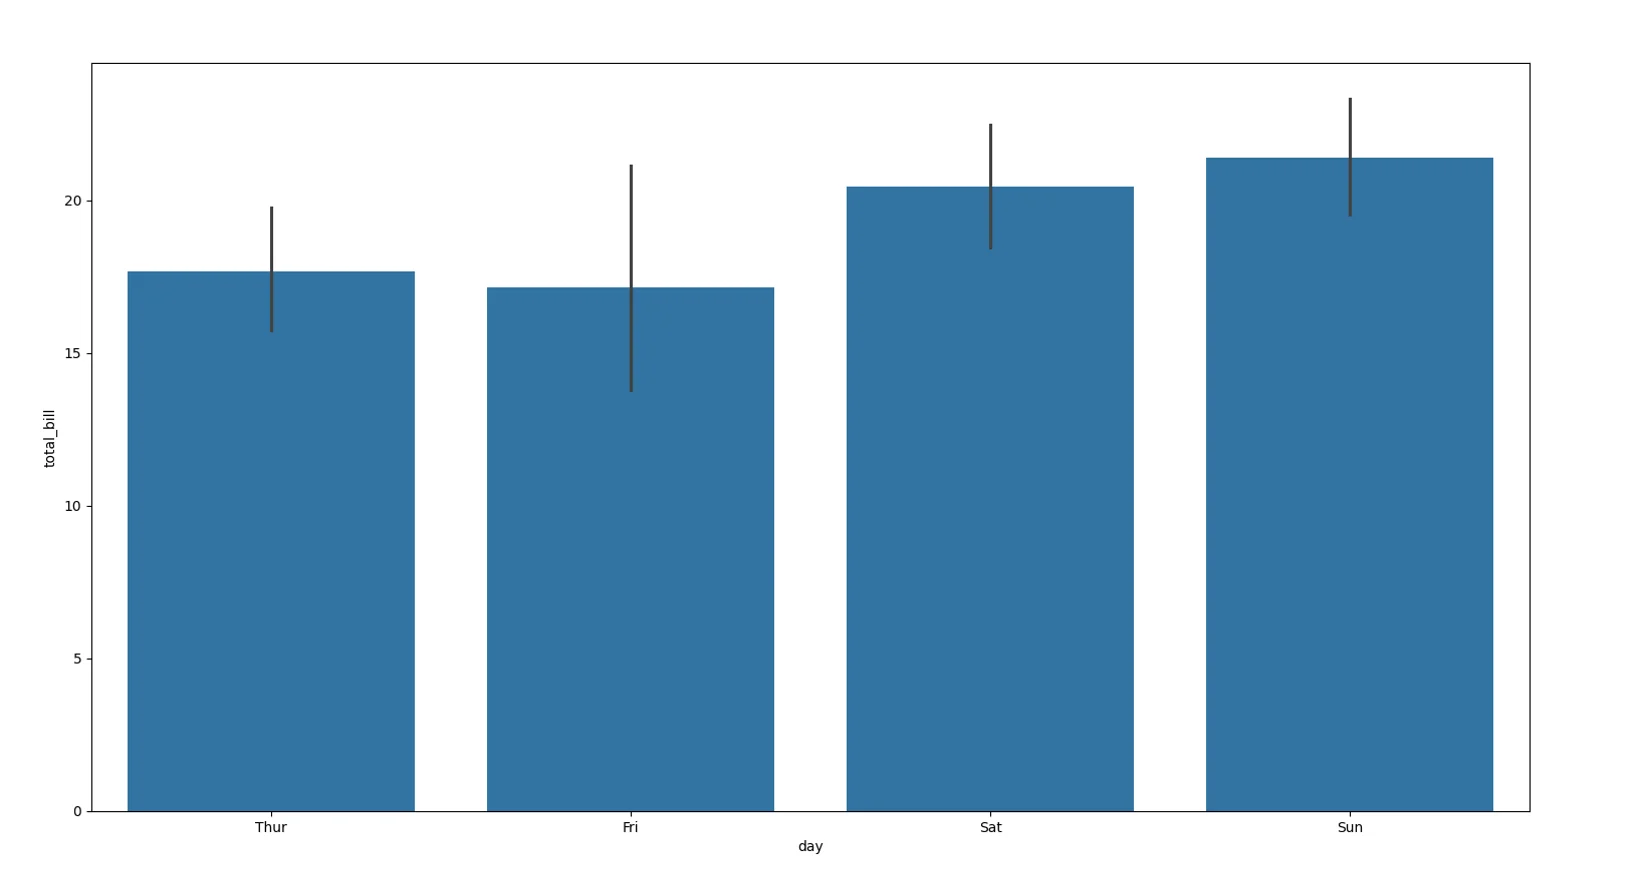
Adding two parameters in the existing code, we can manipulate graphs.
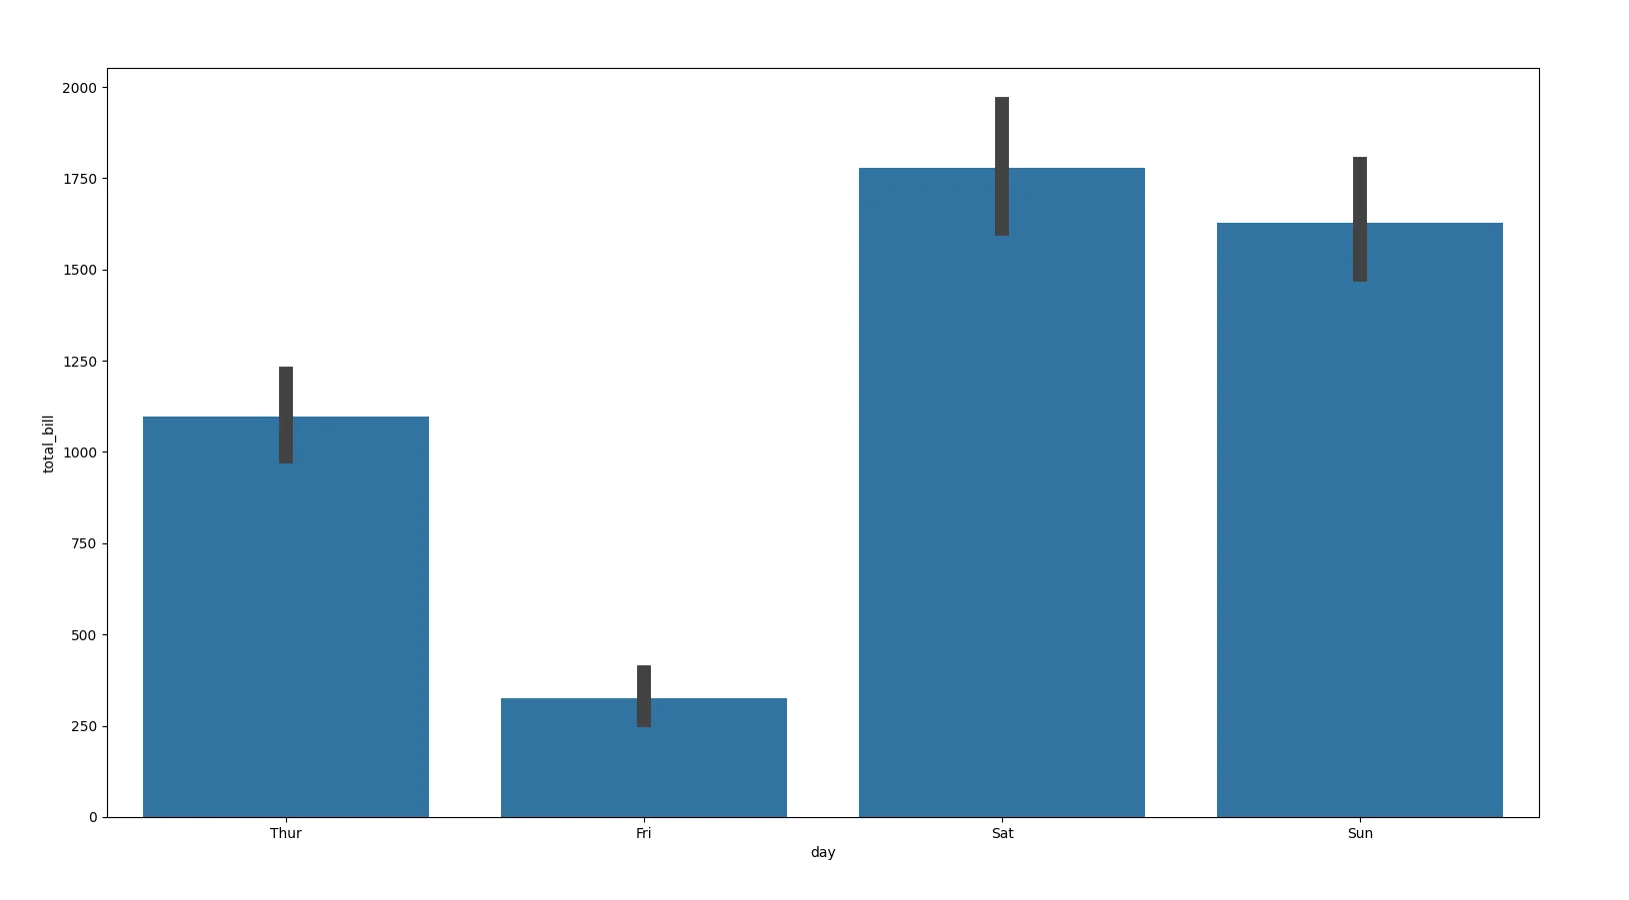
Using estimator we can aggregate the data within each category. Using err_kwargs, we can give additional parameters. In this case we are giving linewidth as additional parameter
Above code will give us resulting graph.
d. Histogram
We will be using histplot function
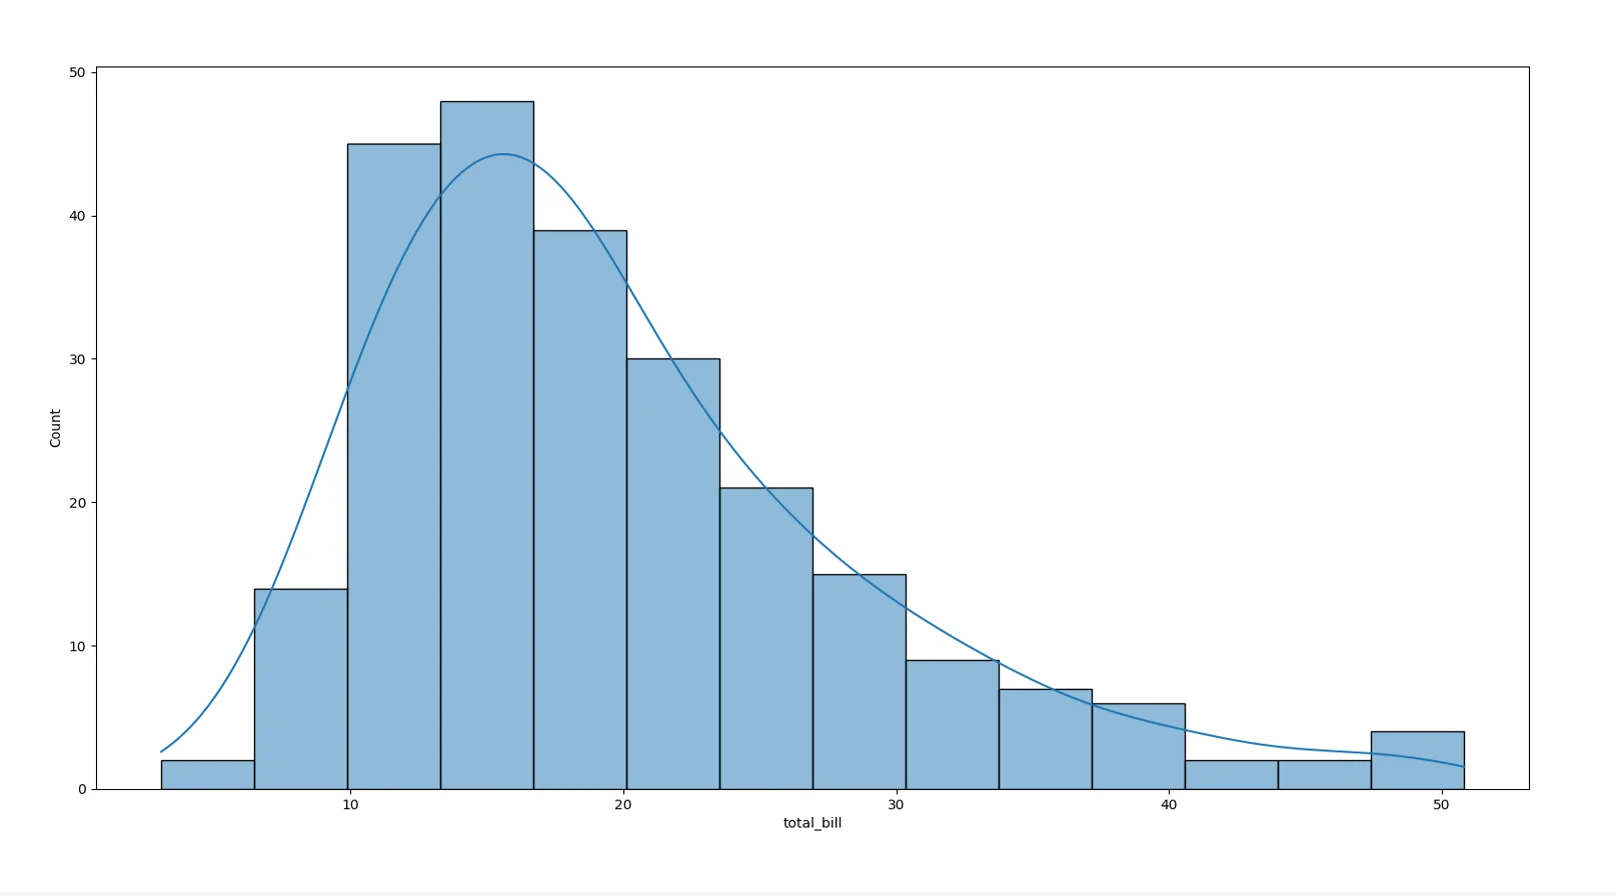
For histogram, we can pass bin, kde_kws where we can give additional parameters. In this case we are giving bw_method as an additional parameter.
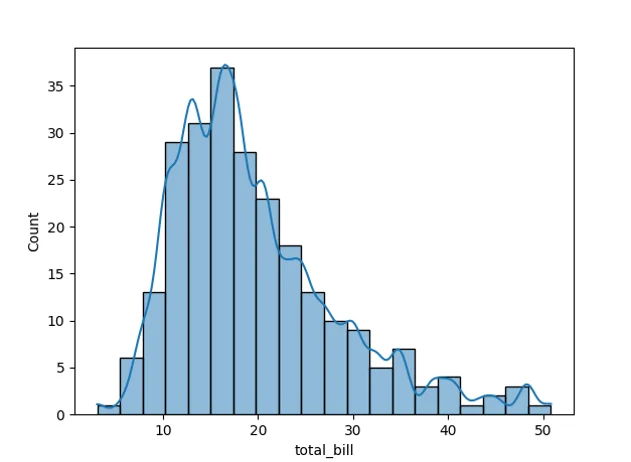
Using bin we can define, how many bars we want to render. Value of bw_method will decide how smooth line will be.
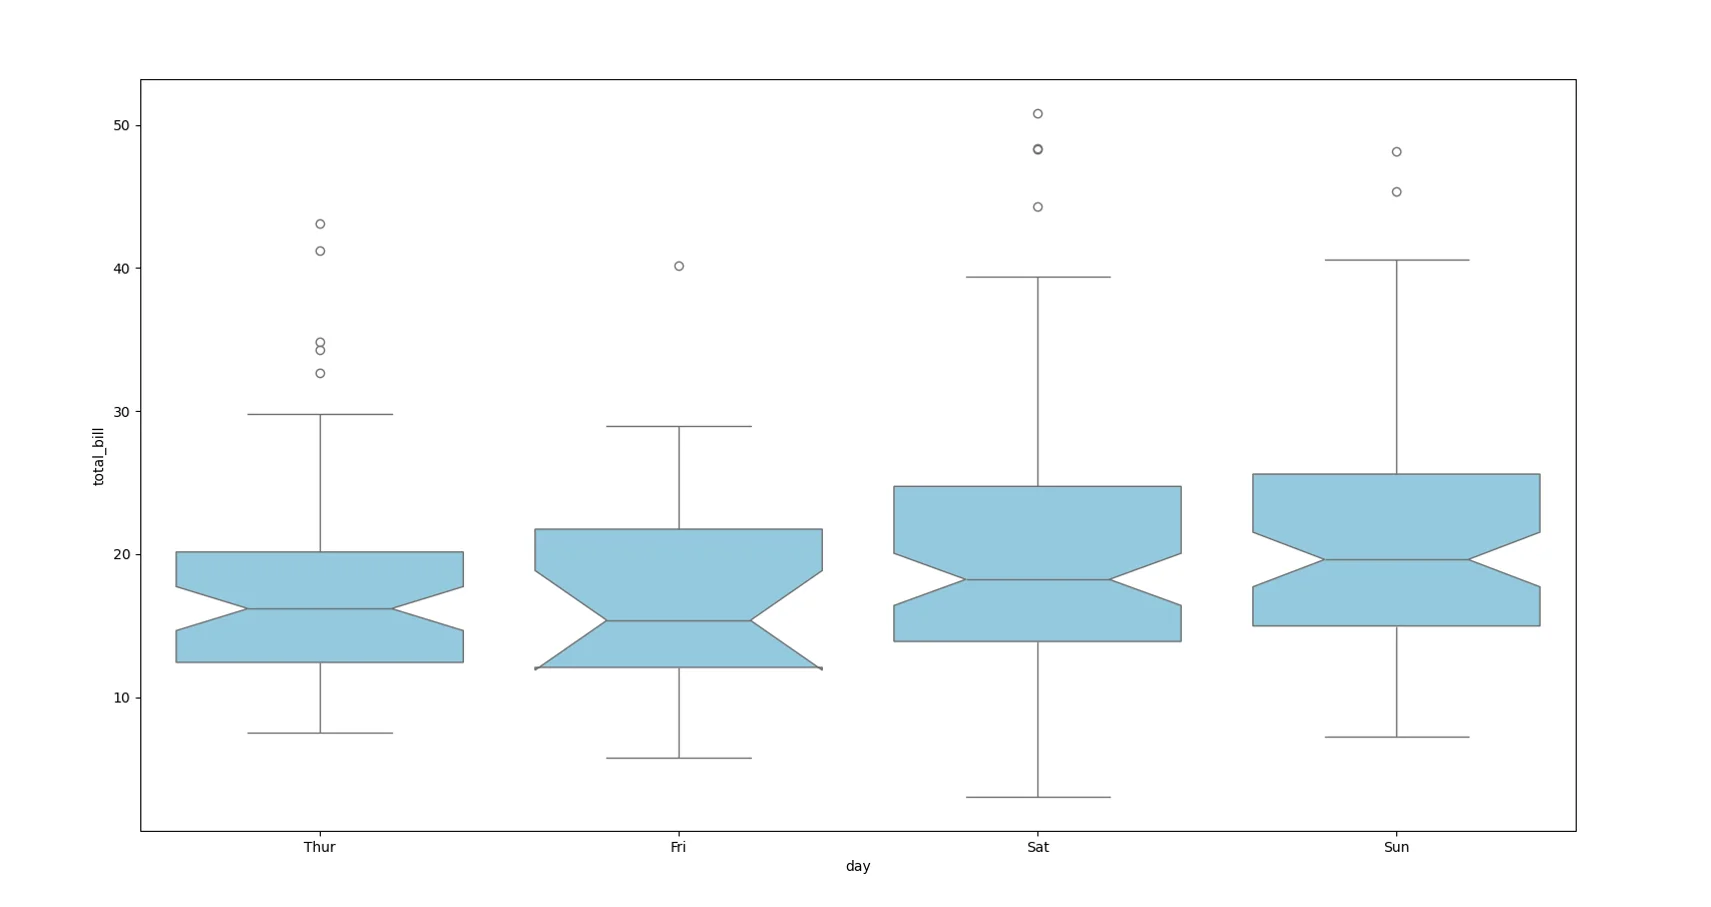
e. Box plot
We will be using boxplot function
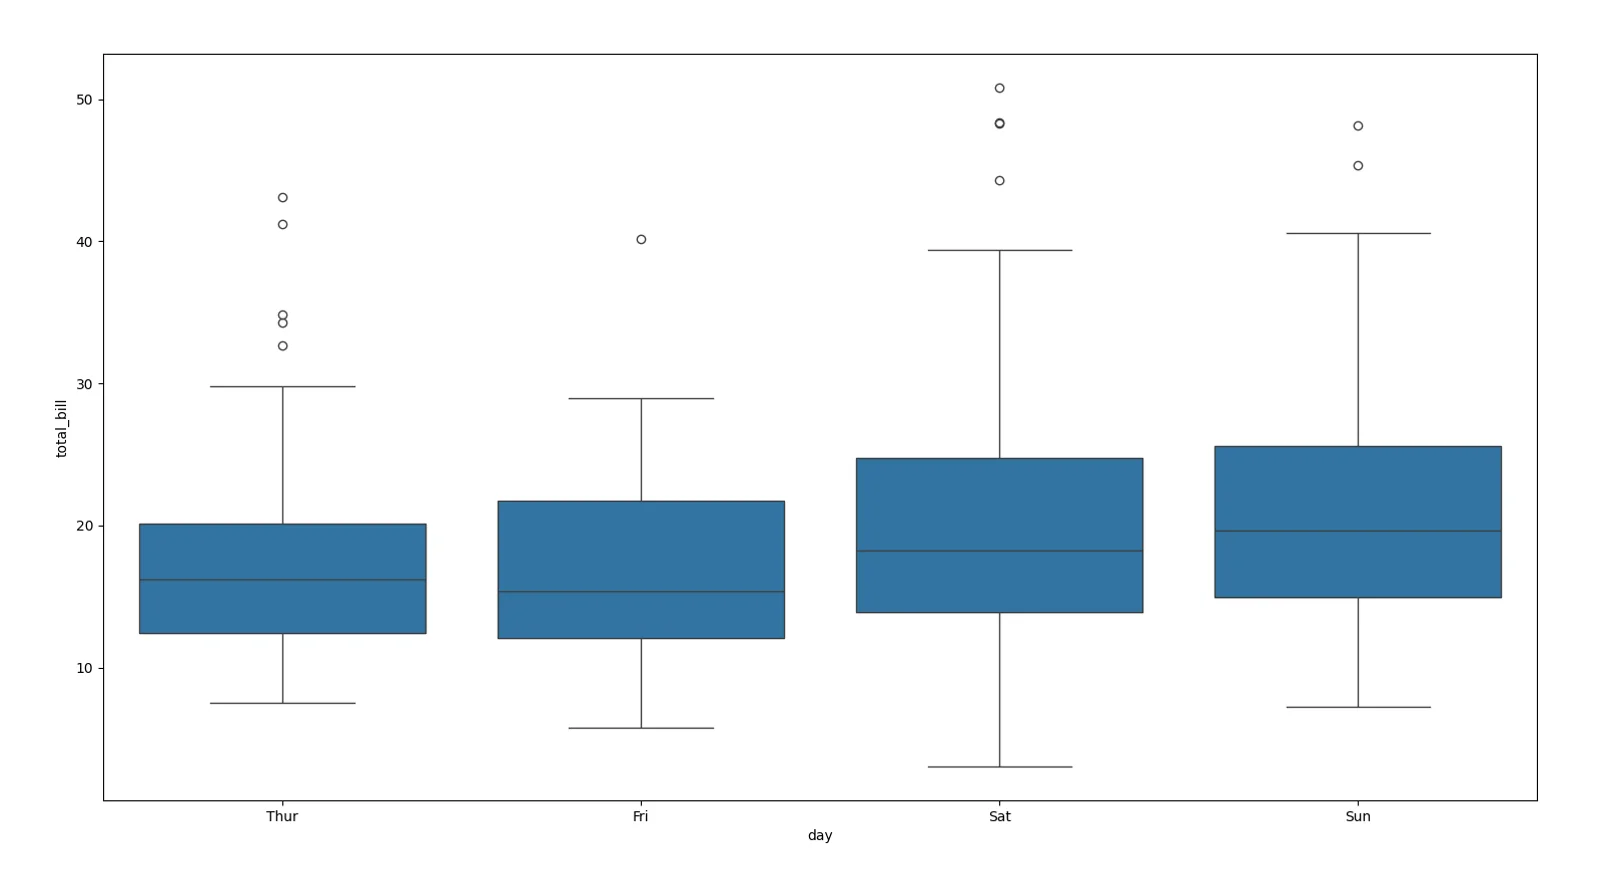
Notch parameter is used to represent the confidence intervals around the median. Color is a parameter which is accepted by all the functions that we have seen and it sets the color of, in this case, boxplot.
Lets see how it works
5. Conclusion
In this article we have seen how seaborn is an advanced version of matplotlib. Under the hood, seaborn is using matplotlib but is an advanced version of it. It gives us flexibility in less code whereas matplotlib probably would require more code.
the article delves into fundamental functions within Seaborn, illustrating its practicality through Scatter plots, Line plots, Bar plots, Histograms, and Box plots. These functions showcase the simplicity and efficiency of Seaborn in creating diverse types of visualizations
6. References
a. https://seaborn.pydata.org/generated/seaborn.scatterplot.html
b. https://seaborn.pydata.org/generated/seaborn.lineplot.html
c. https://seaborn.pydata.org/generated/seaborn.barplot.html
d. https://seaborn.pydata.org/generated/seaborn.boxplot.html
e. https://seaborn.pydata.org/generated/seaborn.boxplot.html